The way our growing cities are planned and built is becoming ever more important in building healthy, liveable and sustainable communities. Much of the focus on liveability has been on Australia’s biggest capital cities, Sydney and Melbourne, which will become megacities of more than 10 million people by 2050. Regional cities are often missing from these conversations, but will be critical for future liveability and sustainable urban development across Australia.
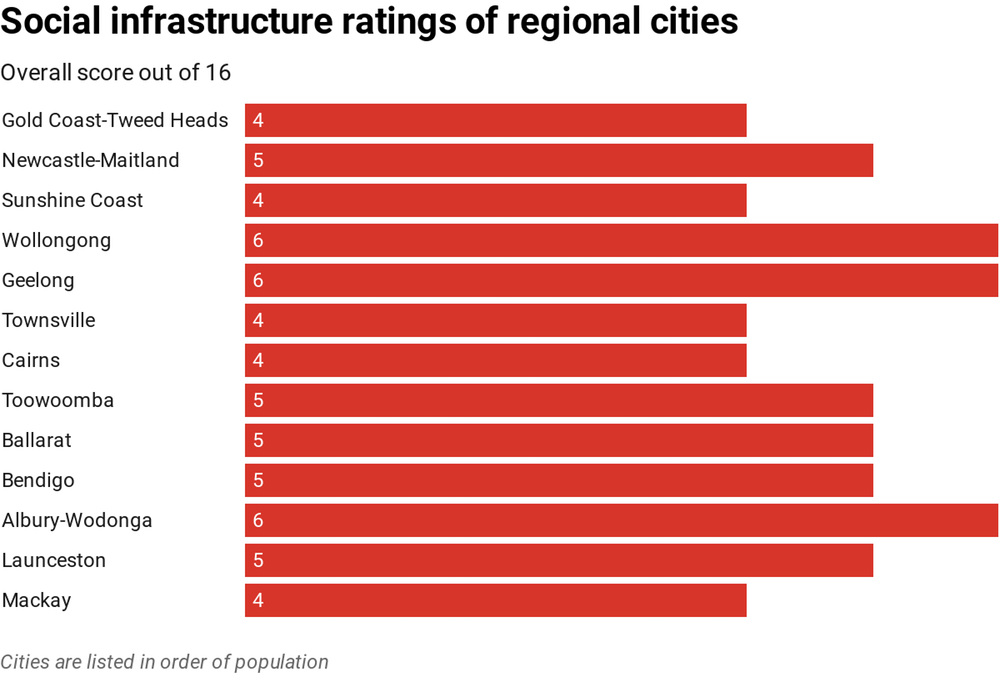
In research for the newly launched Australian Urban Observatory we found people living in urban neighbourhoods of regional cities have satisfactory access to only 31% (five of 16) of essential community services on average. Capital city neighbourhoods have access to 40% on average. This means residents of many parts of both regional and capital cities need more accessible services.
These findings are drawn from Liveability Report scorecards for eight capitals and 13 regional cities, which are now available online.
Good access to community services is a key element of liveability.
We developed the Australian Urban Observatory to make understanding and measuring liveability easier. It’s an online digital platform providing liveability indicators across the nation’s 21 largest cities. (The smallest of these has 80,000 residents.) Together, these cities are home to nearly 20 million people.
The eight capital cities have 67% of Australia’s population. The remaining 13 cities are home to about 13% of Australians.
Many of these regional cities are predicted to grow substantially over the next 30 years. Some are already among our fastest-growing urban areas. These regional cities are Albury-Wodonga, Newcastle-Maitland, Wollongong, Cairns, Gold Coast-Tweed Heads, Mackay, Sunshine Coast, Toowoomba, Townsville, Ballarat, Bendigo, Geelong and Launceston.
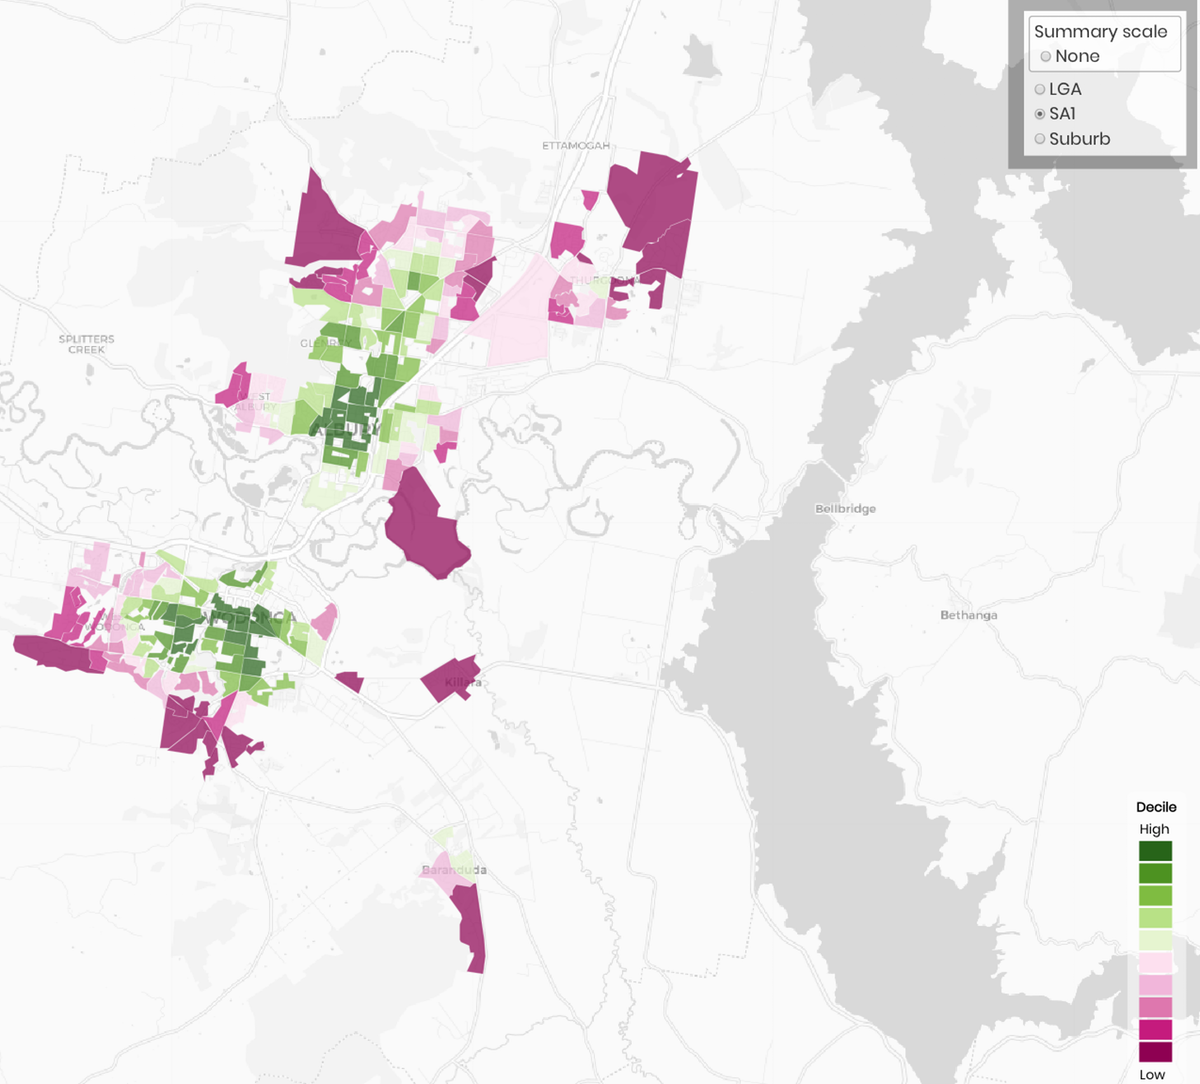
We mapped liveability indicators across the 21 cities at various scales: local government (council) areas, suburbs, and neighbourhoods (ABS Statistical Area 1). This mapping shows all cities have areas where liveability could be improved. And we know inequity in liveability is related to inequity in health.
How is liveability assessed?
The Liveability Index summarises an area’s performance across 13 different topics and 24 service types. These cover all the critical components of our definition of liveability: social infrastructure, walkability, public transport, public open space, housing affordability and local employment.
The Liveability Index for each area is based on an evaluation of its performance relative to all other areas at this scale. Areas performing well on all 13 indicators score higher than 100. Areas scoring lower than 100 are below average for a city.
The Australian Urban Observatory shows how liveability and access to the amenities we need in our daily lives vary across neighbourhoods and suburbs. It enables us to identify relative liveability strengths and weaknesses of areas. Using other indicators to understand these patterns helps to explain area-based scores.
Selecting an area can help to understand what a liveability rating actually means both in absolute terms and relative to other areas of the city.
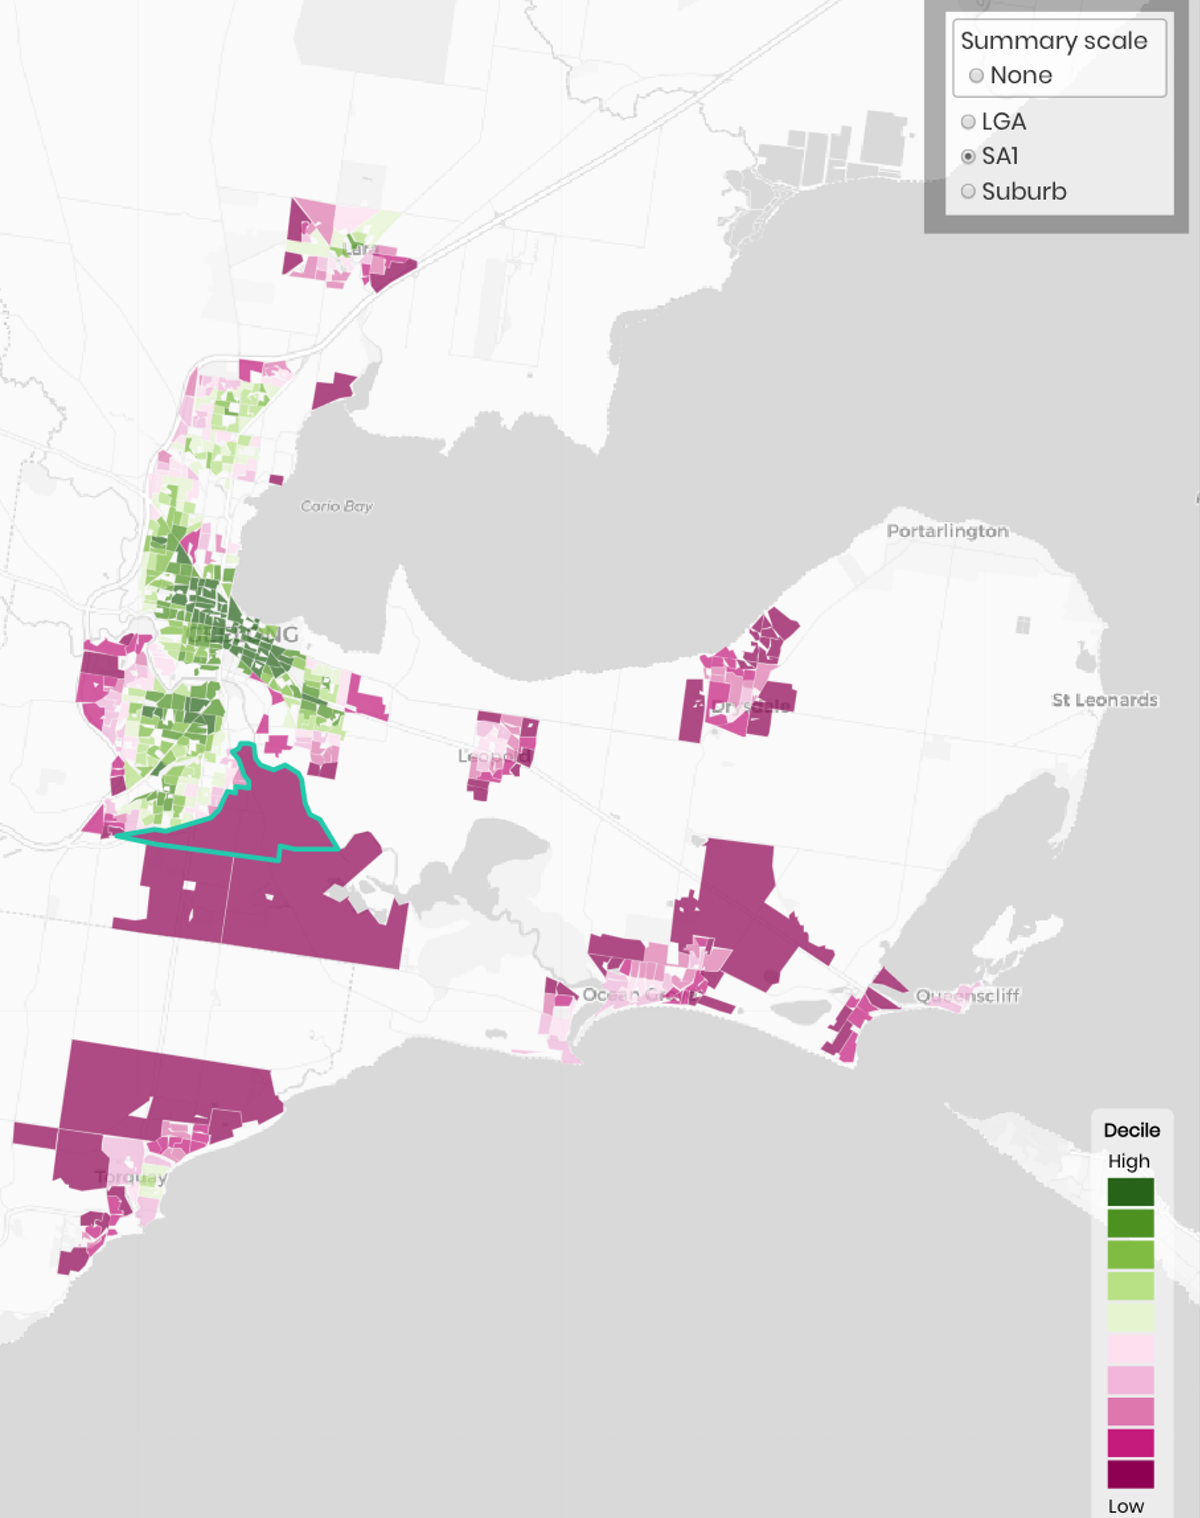
For example, neighbourhood-level ratings in the map below reveal liveability is lower in many outer growth areas of Geelong. It is relatively good in more established neighbourhoods.

